Validating JackDaw with J-VERSE
JackDaw is an AI-powered GeoAI chatbot and spatial intelligence assistant developed under the Horizon Europe project PoliRuralPlus. It is designed to help users interact with maps, datasets, and complex spatial information through natural language queries rather than requiring specialized GIS (Geographical Information System) knowledge.
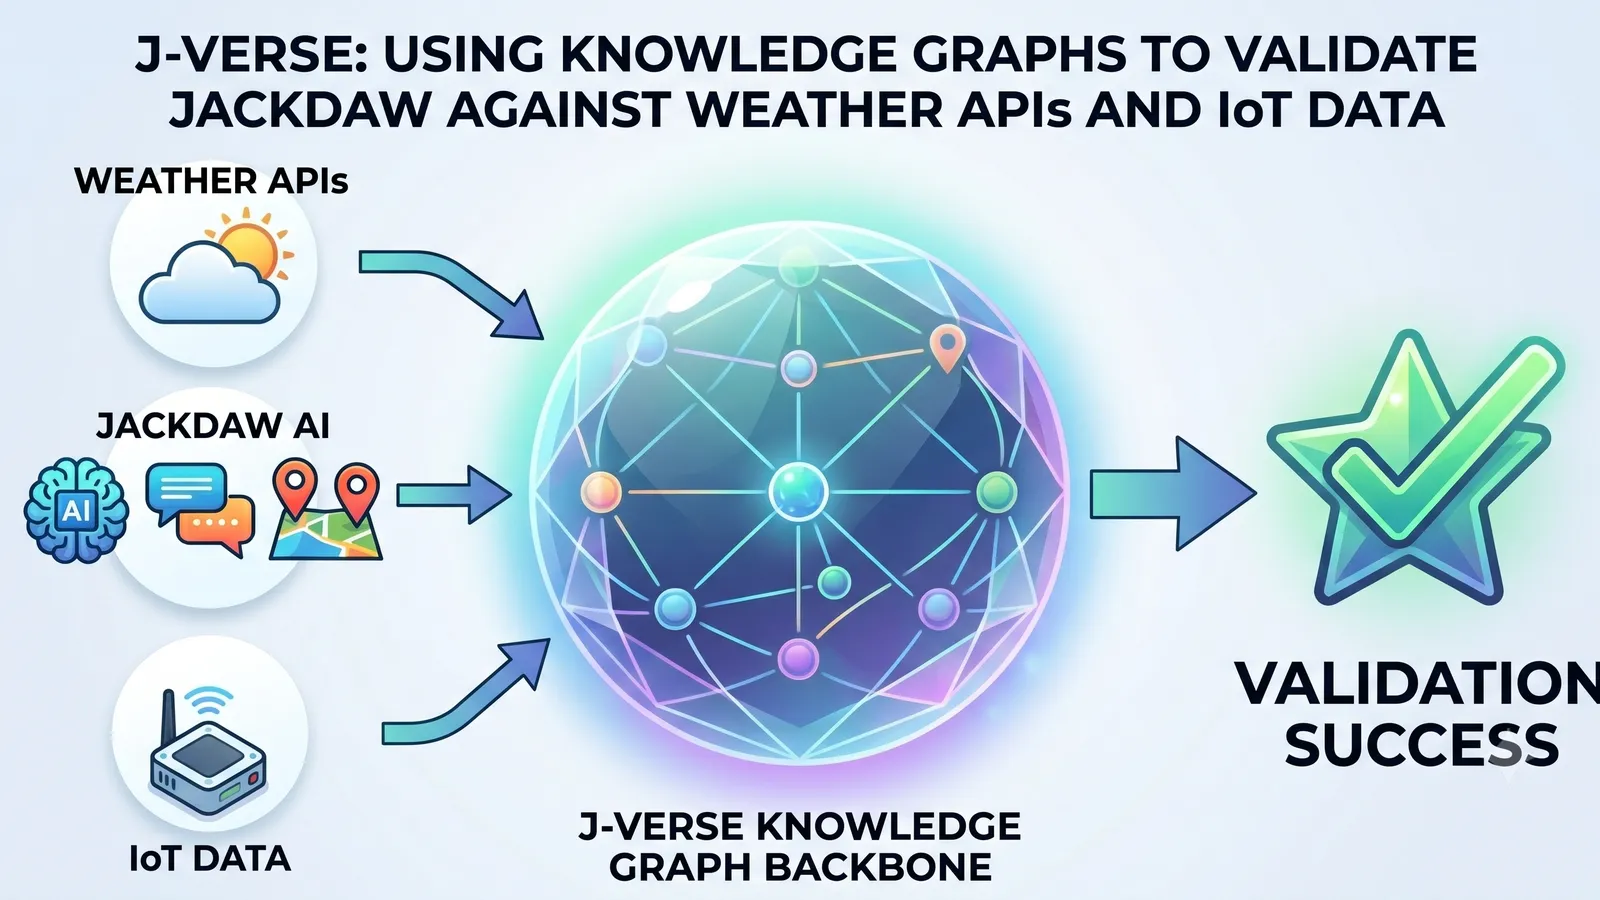
J-VERSE is a validation framework built around Jackdaw within the ENHANCE call, with the goal of systematically testing its performance in real-world settings. The framework focuses on a specific use case involving two contrasting regions in Cyprus: an urban area in Greater Nicosia and a suburban/rural area in Limassol, where different land-use patterns and microclimates influence environmental conditions. To support this validation, J-VERSE integrates independent ground-truth data from the PATROLIoT system, a wildfire and environmental IoT platform that measures temperature and humidity at the local level, alongside data from external weather APIs.
To enable this multi-source integration we employ a Knowledge Graph (KG) that acts as the central data backbone of the system. The KG aligns heterogenous data sources through a shared semantic structure, enabling unified storage, querying, and analysis. By leveraging an ontology-driven design, we ensure that all incoming data can be consistently represented and compared.
Data Collection Across Multiple Sources
The validation setup combines three different data streams: IoT sensor measurements, weather API data, and Jackdaw responses. IoT data is collected through the PATROLIoT devices (Figure 1), which provide continuous environmental readings from deployed sensors. In parallel, an open weather API is queried to obtain reference meteorological data, while Jackdaw is prompted with the same location and time-based queries.
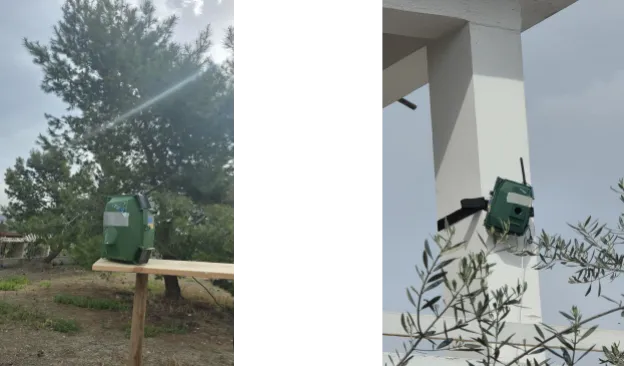
IoT devices deployed in the two pilot locations in Cyprus: urban environment in Nicosia (left) and rural–urban environment in Limassol (right)
As mentioned, the IoT infrastructure is deployed in two distinct regions in Cyprus. One is located in Nicosia, representing a dense urban environment, while the second is placed in Limassol, which reflects a mixed rural–urban setting. This allows us to observe how environmental context may influence both measurements and model responses.
To ensure meaningful comparison, all sources are synchronized in both space and time. IoT devices record measurements at 30-minute intervals, and for each timestamp corresponding values are retrieved from the weather API and Jackdaw. This creates a unified timeline of observations across all systems.
Knowledge Graph for Data Integration
To handle the complexity of these heterogeneous datasets, we developed a Knowledge Graph based on Semantic Web principles. The KG acts as the central integration layer of the system, linking all observations regardless of their origin. At its core, the graph is built on an ontology that defines how weather observations, locations, timestamps, and data sources are represented. This ontology follows established Semantic Web standards and reuses existing vocabularies wherever possible, ensuring both interoperability and extensibility.
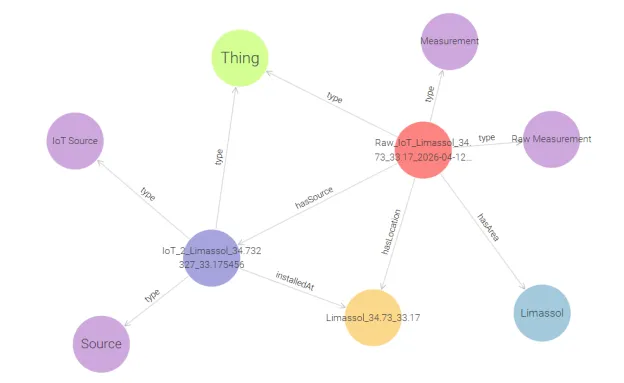
Example visualization of the Knowledge Graph structure
By modeling all data within this shared structure (Figure 2), we can treat IoT readings, API outputs, and Jackdaw responses as comparable entities. This is essential for enabling direct validation, as it removes the structural differences between data sources and focuses purely on the values they produce.
The Knowledge Graph enables complex cross-source queries that would be difficult to handle with raw, unstructured data. For example, it can answer questions such as:
- How does Jackdaw’s reported temperature compare to IoT and API measurements for the same location and timestamp?
- What is the average daily temperature difference between Jackdaw, the IoT sensors, and the weather API?
- During which time periods does Jackdaw most closely align with external weather APIs?
- In which location (Nicosia or Limassol) are the differences between Jackdaw and IoT measurements larger?
Results and Analysis
Once the data is extracted from the Knowledge Graph, we perform a series of comparative analyses to evaluate Jackdaw’s performance. The results are primarily visualized through time-series plots that show temperature trends across IoT, API, and Jackdaw outputs.
These visualizations make it possible to observe how closely Jackdaw follows real-world measurements and where deviations occur.
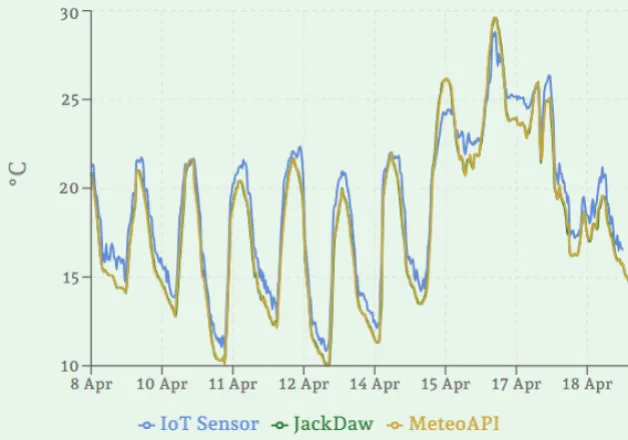
Visualization of temporal differences between the three data sources over a 10-day period in Limassol
The figure visualizes the temperature comparison between Jackdaw, the weather API, and the IoT measurements over the period from 8th to 18th of April. During this time window, Jackdaw shows a very close alignment with the weather API, following nearly identical temperature trends and variations. Specifically, Jackdaw exhibits an average temperature difference of 0.16°C compared to the API and 1.07°C compared to the IoT measurements.
A larger deviation can be observed when comparing both Jackdaw and the API against the IoT data. This is expected, as the IoT devices capture ground-truth environmental conditions at the exact deployment location, while weather APIs rely on broader area-level meteorological estimations and forecasting models. The strong agreement between Jackdaw and the API therefore indicates that Jackdaw’s responses are most likely aligned with API-based weather predictions rather than local point-level measurements.
Conclusion
By combining IoT infrastructure, external weather APIs, and Jackdaw responses within a unified Knowledge Graph, we establish a structured and scalable validation framework for evaluating Jackdaw. The semantic layer provided by the ontology enables heterogeneous data sources to be uniformly represented, linked, and queried within a single environment.
Since external systems can be integrated with Jackdaw, it is particularly interesting to consider integrating our semantic Knowledge Graph in future developments so that it could provide structured grounded contextualisation and support more advanced comparisons and analytical queries. Such an integration could allow access to richer, semantically connected environmental information that is difficult to achieve with isolated or unstructured datasets, while also opening the door to extending the framework to additional regions, sensors, environmental indicators, and other AI-driven systems.

Existing Comments