How much energy could a renovation save? What would it cost, and how would it affect emissions? What happens to carbon storage when a new building, road, power line or renewable-energy site is planned?
These questions are central to Europe’s green transition, but answering them often requires information scattered across technical reports, databases and specialist software. Smaller municipalities, rural communities and property owners do not always have the resources needed to combine this information or compare alternative scenarios.
The Avoin Map project has explored how open, map-based services can make these questions easier to examine. Two pilot services, the Energy Map and Zoning Map, have been developed and tested through practical cases and stakeholder interaction connected to the Mallusjoki pilot region.
Europe’s buildings need faster renovation
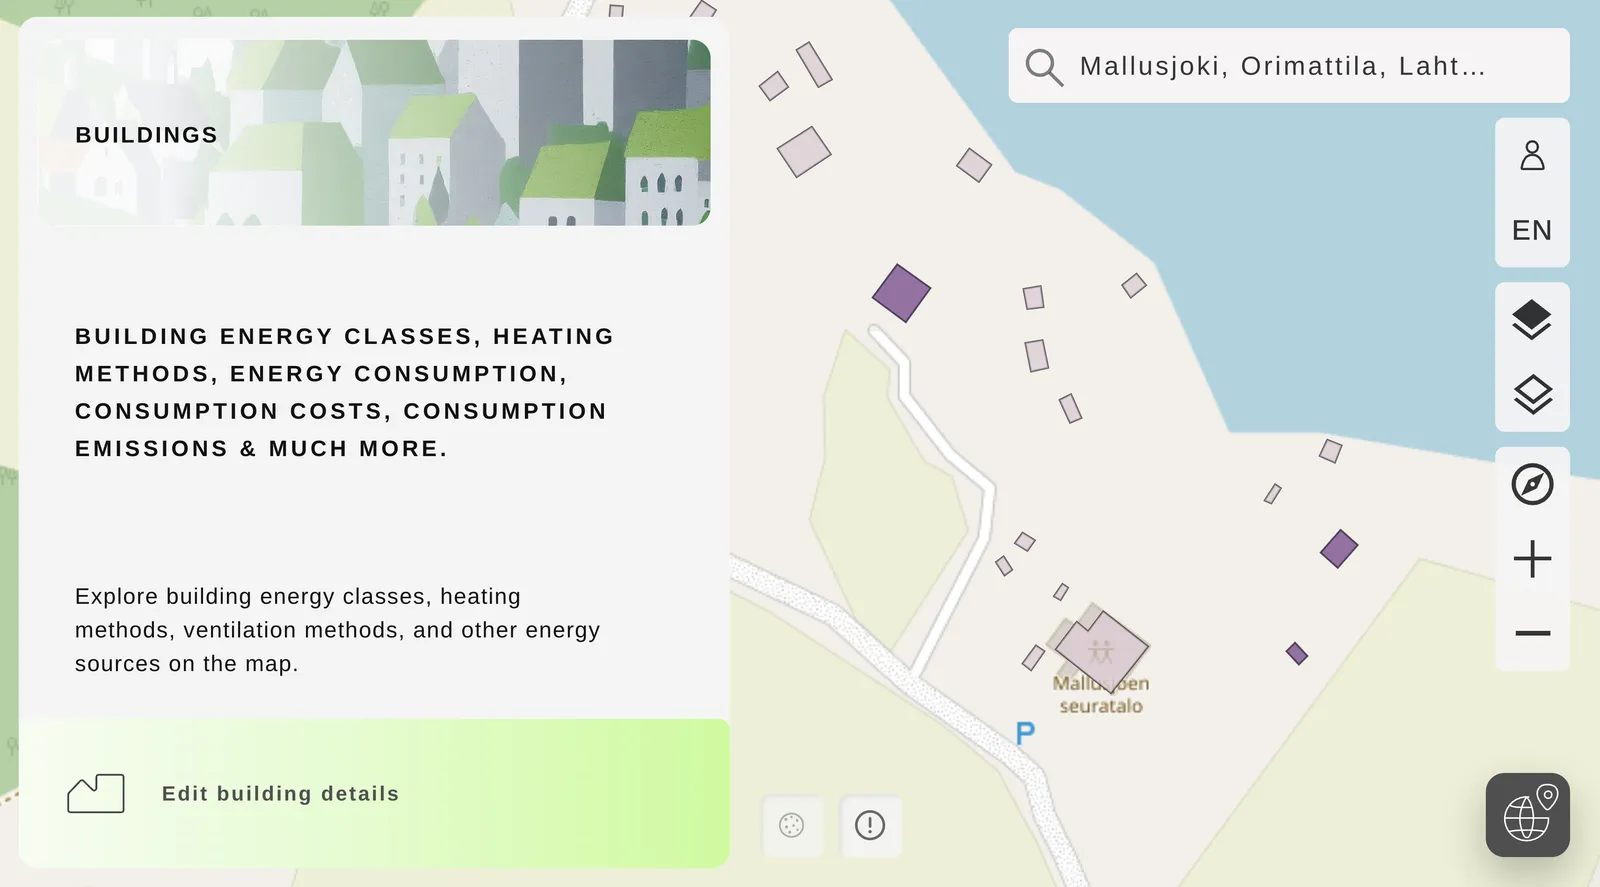
Image: The Energy Map web service centred on the Mallusjoki pilot area in Finland.
Buildings are Europe’s largest individual energy-consuming sector. According to the European Commission, buildings account for around 40% of EU energy consumption. Approximately 85% of the building stock was constructed before 2000; 75% has poor energy performance, and the annual renovation rate remains close to only 1%.
Improving existing buildings is therefore essential for reducing energy consumption, emissions and costs. The revised Energy Performance of Buildings Directive supports the transition towards a zero-emission European building stock by 2050.
However, renovation decisions are rarely straightforward. A technically effective measure may require a large investment, while a cheaper measure may deliver only limited savings. Cultural and community buildings introduce additional considerations: their heritage values, patterns of use and local importance must also be understood.
The Energy Map pilot was designed to help users examine building energy performance and compare renovation options through a visual interface. It brought together information on energy consumption, costs and environmental impacts so that different measures can be considered within the same service.
In Mallusjoki, the development was connected to practical planning for the local community hall. Cooperation with the Mallusjoki Youth Association included discussions about renovation needs, a building survey, laser scanning, drone imaging and the preparation of initial condition plans. Saatsi Arkkitehdit contributed architectural and renovation expertise, while stakeholder interviews and workshops helped identify which datasets and comparisons would be most useful in real planning discussions.
A map service does not replace an energy audit, architectural planning or professional engineering. Its value is earlier in the process: it can make options visible, support informed questions and help property owners, communities and experts establish a shared starting point.
Land-use decisions also have a climate balance
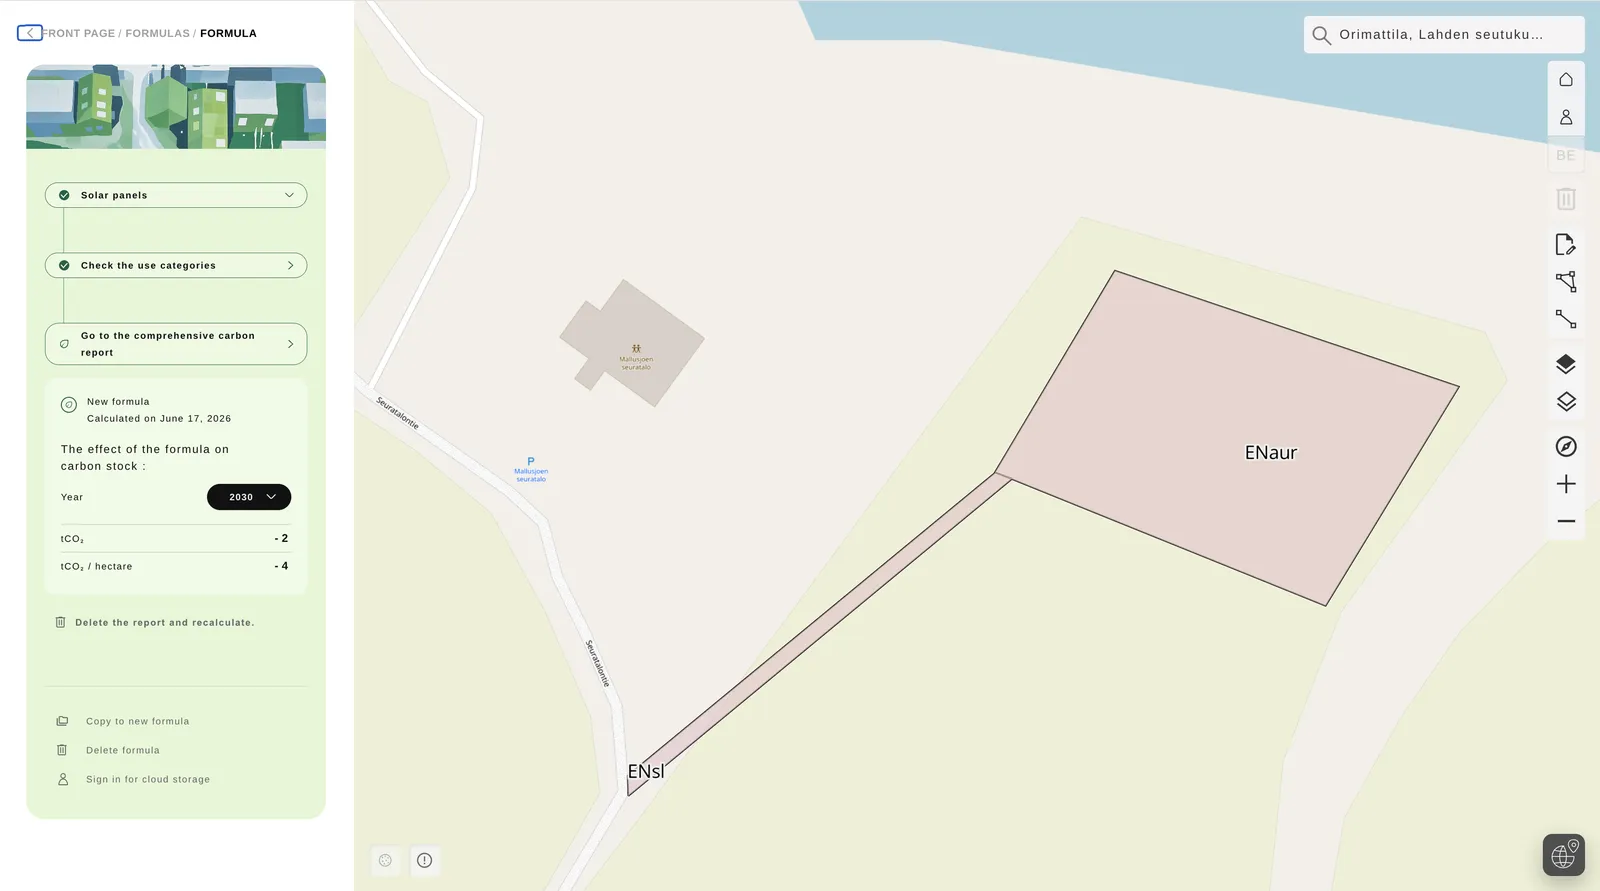
Image: The Zoning Map web service centred on the Mallusjoki pilot area in Finland, showing the estimated effect of a hypothetical solar energy site and power line on soil and vegetation carbon stocks.
Rural areas are central to the expansion of renewable energy, electricity networks, housing, mobility and other infrastructure. At the same time, they contain forests, agricultural land, wetlands and soils that store carbon and support biodiversity.
Europe’s land carbon sink is under growing pressure. The European Environment Agency estimates that the EU land-use and forestry sector removed approximately 198 million tonnes of CO₂ equivalent in 2023, offsetting around 6% of EU greenhouse-gas emissions. This remains well below the EU target of 310 million tonnes of net removals by 2030, and the EEA concludes that existing and planned measures are not yet sufficient.
This makes it increasingly important to consider land-use impacts before plans are fixed. Climate-conscious planning should not simply ask whether development is needed. It should also ask where it should take place, which alternative causes the least harm, and whether negative impacts can be reduced or compensated.
The Zoning Map pilot provides a visual environment for examining carbon storage, carbon sinks, emissions and changes in land use. Its development has included features for comparing land-use scenarios, planning linear infrastructure, editing land-use assumptions and exporting geospatial results.
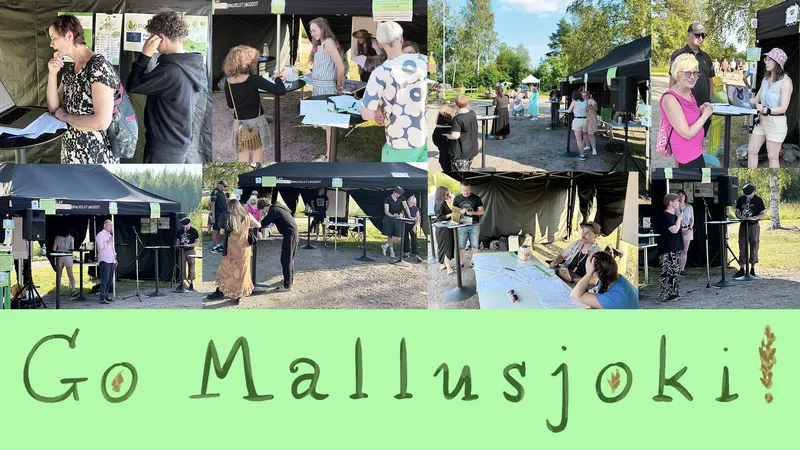
The service has been tested with stakeholders from the Mallusjoki area and with national expert organisations. Feedback has particularly highlighted potential applications in planning renewable-energy production sites, power lines and other infrastructure whose climate effects extend beyond their operational emissions.
As with the Energy Map, the Zoning Map is a decision-support tool, not an automatic decision-maker. Land-use planning must also consider biodiversity, water systems, landscapes, livelihoods, cultural values, legal requirements and public participation. Carbon is an important part of the picture, but it is not the entire picture.
From static reports towards interactive scenarios

Illustration by Linda Mandell
A broader European trend is the move from static datasets towards interactive, scenario-based planning. The European Commission is supporting interoperable data spaces and local digital twins that allow communities to evaluate how different choices could affect energy, transport, emissions and other local systems. Its work on smart and sustainable communities increasingly emphasises reusable tools, open standards and simulations that can serve municipalities of different sizes.
For rural areas, this development is promising, but it must remain realistic. More data does not automatically result in better decisions. Information must be understandable, assumptions must be transparent, and services must reflect local capacity and actual planning processes.
Research on European smart villages similarly indicates that digital initiatives are more durable when they are adapted to everyday practices, supported by local organisations and developed with multiple stakeholders. Technology works best as an enabling tool within a wider process of cooperation.
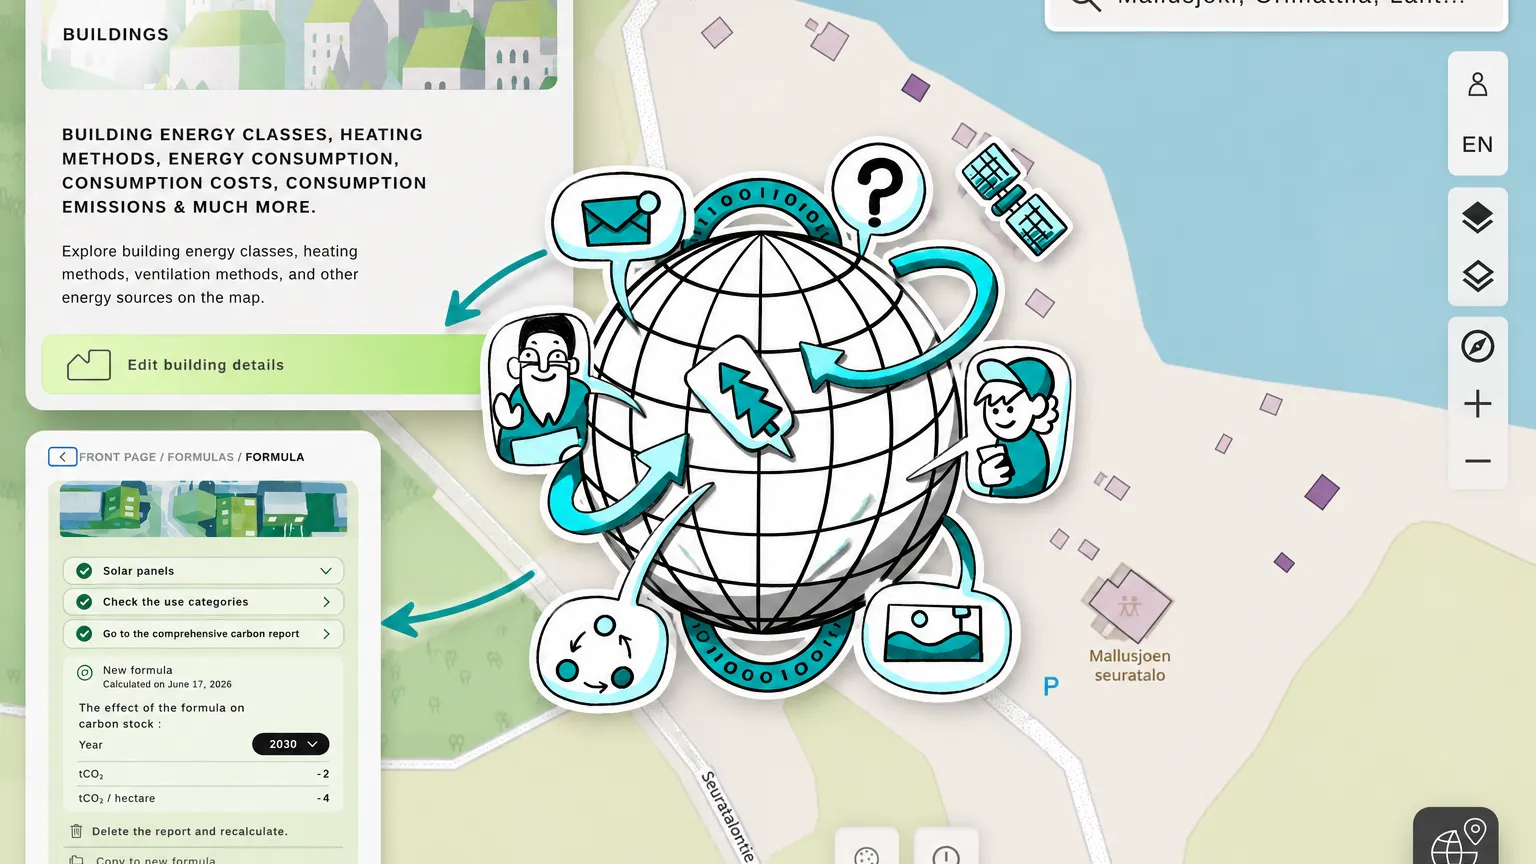
The Mallusjoki pilots offer a small but practical example of this direction. Energy Map and Zoning Map translate complex calculations into spatial views that can be explored and discussed. Their open-source and modular foundations also make it possible to adapt them to other buildings, municipalities and regions.
Europe’s sustainability transition will require major investments in renovation, renewable energy and infrastructure. It will also require tools that help communities understand the consequences of different choices. Open map services can contribute by making evidence more visible and by bringing technical information into conversations where real decisions are made.
The Avoin Map project has received funding from the PoliRuralPlus project.
PoliRuralPlus has received funding from the European Union’s Horizon Europe research and innovation programme under Grant Agreement No. 101136910. Views and opinions expressed are however those of the author(s) only and do not necessarily reflect those of the European Union or the European Research Executive Agency. Neither the European Union nor the granting authority can be held responsible for them.
Existing Comments