From expectations to hands-on testing
The first FloodAI+ workshop established clear expectations. Stakeholders wanted maps that explain risk, understandable answers for different users, information about exposed people, roads and critical facilities, and transparent communication of uncertainty. They also wanted flood-risk information connected to practical decisions.
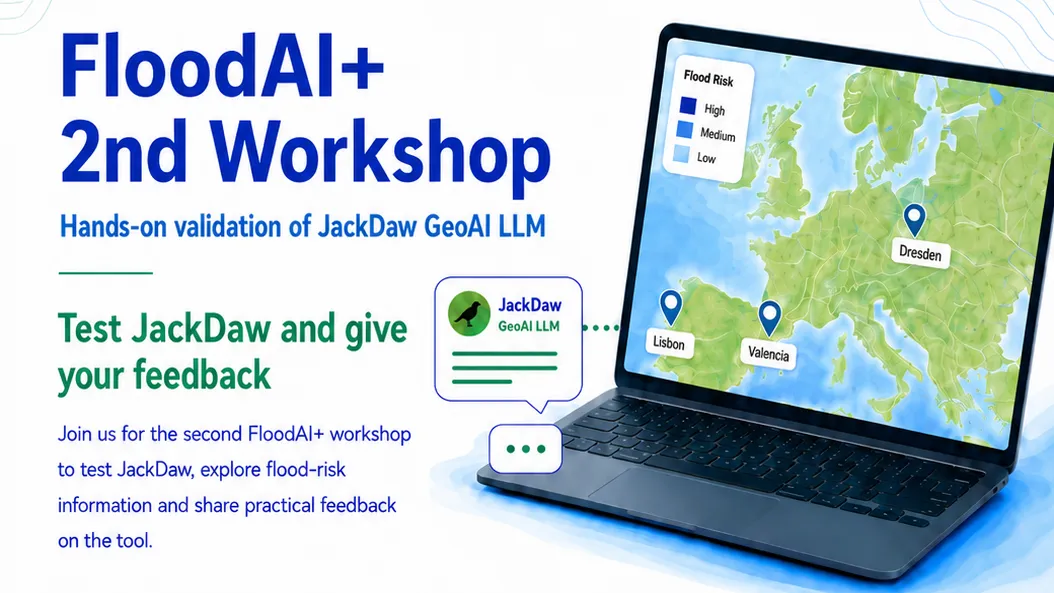
On 13 July 2026, the second workshop moved from discussing what JackDaw should do to testing it in practice. During a one-hour online session, participants logged in, used their own flood-risk questions or role-based examples, assessed the answers and recorded Mentimeter feedback. Suggested tasks covered exposed areas, plain-language explanations, roads and assets, location comparisons and information needed before prevention measures are considered.
The results are a validation checkpoint, not a representative survey (Figure 1). Up to 20 people contributed to individual Mentimeter questions, but totals varied and some ratings included omitted answers. The findings are therefore descriptive evidence from a small session. Even so, they provide a consistent picture of what created value and what still limits trust.
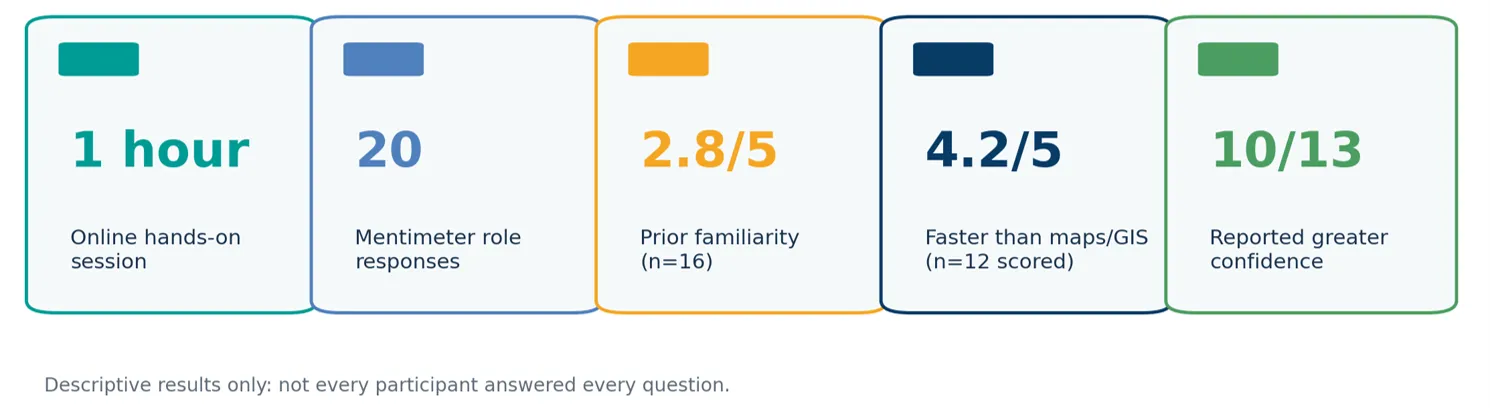
Figure 1 – Workshop 2 at a glance: participation, familiarity, speed and post-session confidence.
Source: FloodAI+ Workshop 2 Mentimeter feedback, 13 July 2026; question-level response counts vary.
Who contributed and why the sample matters
The participant profile was useful, with some areas offering more insight than others (Figure 2). Among 20 role responses, seven came from researchers or technical experts, four from students and three from municipal or regional planners. Citizens and other roles contributed two each; civil protection and SMEs or infrastructure operators one each. No respondent selected farmer or rural actor, or NGO or community organisation. Pilot connections were mixed. Among 18 responses, six were linked to Lisbon, two to Dresden and one to Valencia; five had no specific pilot connection, one came from another European region and three preferred not to say. Familiarity with GeoAI or spatial flood-risk tools averaged 2.8 out of 5 among 16 respondents. The workshop therefore cannot demonstrate how well the tool works for farmers, rural organisations or a balanced cross-section of the three pilots.
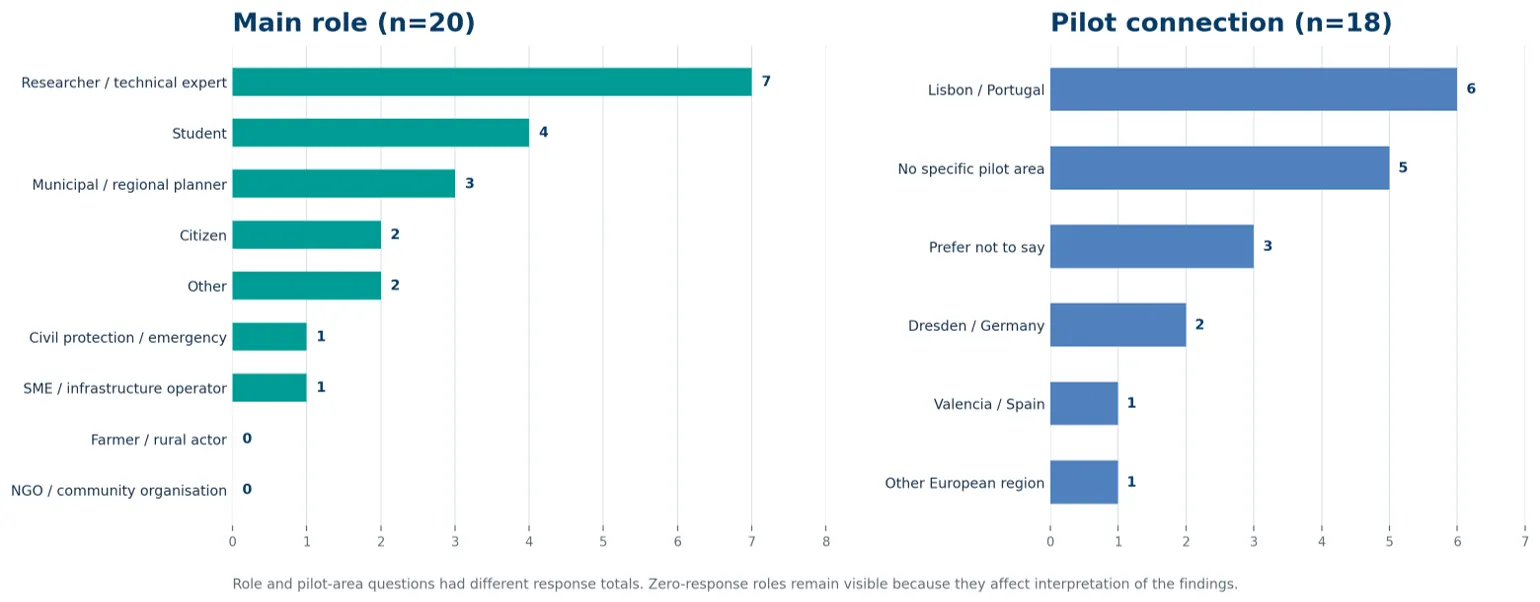
Figure 2 – Aggregated participant profile by main role and pilot-area connection.
Source: FloodAI+ Workshop 2 Mentimeter feedback, 13 July 2026; question-level response counts vary.
Fast access was JackDaw’s clearest strength
Speed was the strongest quantitative signal. JackDaw’s ability to help participants find or understand information faster than traditional maps or GIS dashboards scored 4.2 out of 5. Willingness to use a similar tool in future planning, communication, training or engagement also scored 4.2. Trust for preliminary discussion, awareness-building or planning support scored 4.0.
Open responses give the scores practical meaning (Figure 3). Participants highlighted quick answers, simple area selection and an interface that felt easier than handling GIS directly. One valued ‘fast and understandable answers about flood risk characteristics’; another described the web interface as easier for non-experts. ‘Nice’, ‘simple’ and ‘useful’ were the most repeated experience words, but ‘limited’, ‘needs to go deeper’ and ‘still needs progress’ also appeared. Conversational access removed friction, while the underlying result still needed more depth.
Speed was the strongest quantitative signal. JackDaw’s ability to help participants find or understand information faster than traditional maps or GIS dashboards scored 4.2 out of 5. Willingness to use a similar tool in future planning, communication, training or engagement also scored 4.2. Trust for preliminary discussion, awareness-building or planning support scored 4.0.
Open responses give the scores practical meaning (Figure 3). Participants highlighted quick answers, simple area selection and an interface that felt easier than handling GIS directly. One valued ‘fast and understandable answers about flood risk characteristics’; another described the web interface as easier for non-experts. ‘Nice’, ‘simple’ and ‘useful’ were the most repeated experience words, but ‘limited’, ‘needs to go deeper’ and ‘still needs progress’ also appeared. Conversational access removed friction, while the underlying result still needed more depth.
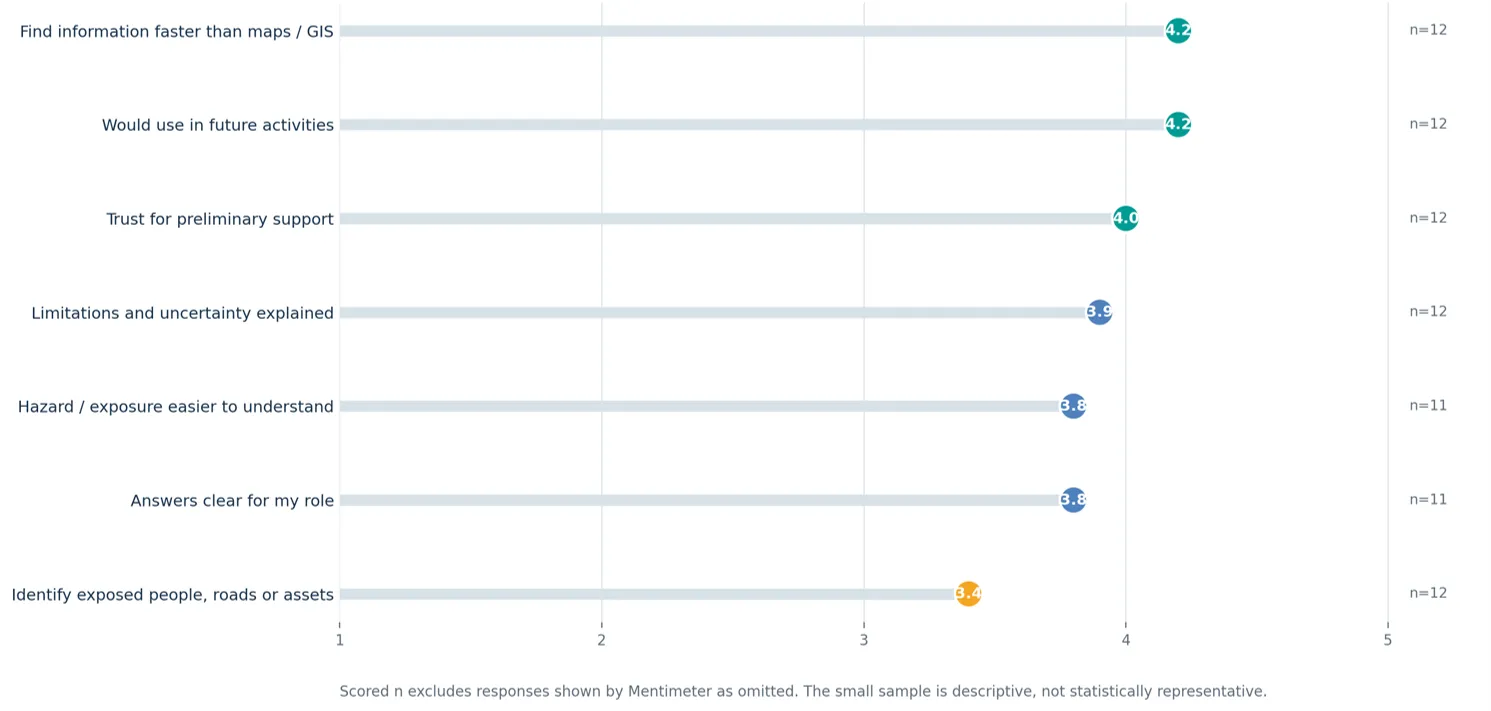
Figure 3 – Mean ratings from Workshop 2 on a 1–5 agreement scale.
Source: FloodAI+ Workshop 2 Mentimeter feedback, 13 July 2026; question-level response counts vary.
“Conversational speed created value, but trust still depended on seeing the answer on a map and understanding where it came from.”
Confidence improved, but confidence is not validation of accuracy
Ten of 13 respondents felt more confident interpreting flood-risk information or spatial indicators after the session: seven slightly and three significantly (Figure 4). Two reported no change, one was unsure and none selected ‘still difficult to understand’. This is an encouraging learning signal, but it does not prove that every answer was correct or that participants could complete a formal risk assessment. It shows that most respondents felt better able to engage with the information.
In a multiple-selection question answered by 11 people, municipal planners received nine selections as potential beneficiaries; emergency managers and researchers or technical experts seven each; and farmers or rural actors six. These are perceptions, not measured impacts, particularly important because farmers were not represented in the role responses, but they point to priorities for further validation.
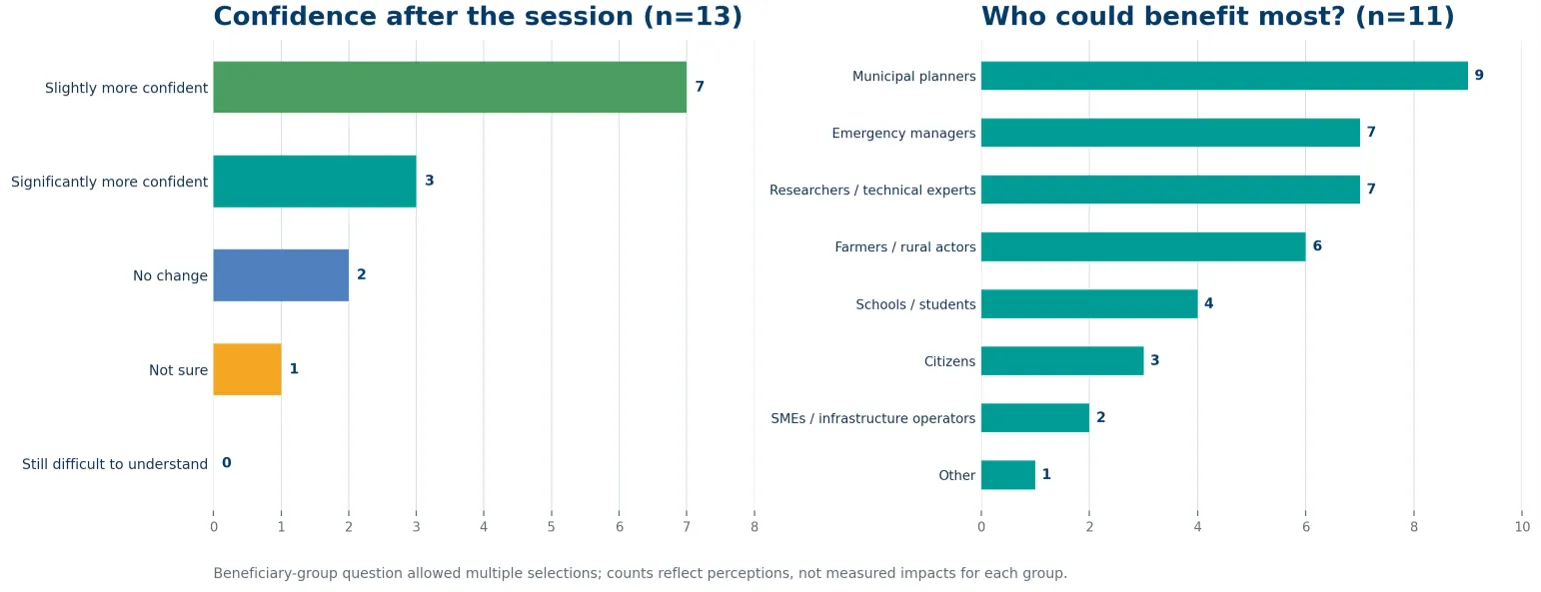
Figure 4 – Post-session confidence and user groups perceived to benefit most.
Source: FloodAI+ Workshop 2 Mentimeter feedback, 13 July 2026; question-level response counts vary.
Trust depended on location, provenance and data coverage
The lowest rating, 3.4 out of 5, concerned whether JackDaw made it easier to identify which people, roads, land-use areas or critical facilities might be exposed. Qualitative feedback explains the gap. Participants wanted answers marked on a map, a flood layer overlaid by default, geolocation at street or block level, and road information expressed as locations rather than only kilometres. A summary such as an average or maximum was not enough when its spatial meaning was unclear.
Trust also depended on provenance. Respondents asked where references were shown, where AI had been used, and how methodology and accuracy could be judged. Some questions were not answered, creating uncertainty about data coverage. The rating for explaining limitations, uncertainty and data constraints was a relatively positive 3.9 out of 5, and one useful-feature comment appreciated that the system explained when information was not in the dataset. Even so, the open responses show that caveats need to be more visible, consistent and closely connected to each result.
Turning feedback into an improvement agenda
The open responses explain why the ratings matter. Four of the eight improvement comments explicitly asked for more visual or map-based output; two referred to mitigation guidance. Other requests concerned clearer limits, more data, several languages and a catalogue of typical questions. Table 1 turns those signals into a practical, evidence-based agenda without implying that every request has already been implemented.
| Workshop signal | Evidence from Workshop 2 | Implication for JackDaw |
|---|---|---|
| Keep the interaction fast | A 4.2/5 rating against traditional maps or GIS; speed recurred in useful-feature comments. | Preserve short response times and a low-friction area-selection workflow. |
| Put answers on the map | Requests for a base flood overlay, marked assets, street/block detail and road locations; exposure identification scored 3.4/5. | Link summaries to visible locations and make spatial units explicit. |
| Show sources and limits | Questions about references, methodology, accuracy and where AI was used. | Display source, coverage, date, uncertainty and missing-data cues close to each result. |
| Help users ask better questions | Participants asked what to ask and suggested a glossary of typical questions. | Offer role-based prompts and a concise question catalogue. |
| Support language and role differences | Mentimeter included ‘Idioma’ and a request to ‘Enable several languages’. | Use multilingual explanations and stakeholder profiles, with further user validation. |
| Connect risk to action carefully | Two improvement comments requested mitigation ideas alongside flooded-area information. | Provide bounded links to prevention guidance while preserving expert and authority roles. |
How the three FloodAI+ tools respond
The final FloodAI+ technical work brings together three complementary MCP tools in the JackDaw/Raven environment. They should not be presented as if every workshop participant tested each tool separately. The Mentimeter results evaluate the overall JackDaw experience, while the final code package documents what has been implemented and technically tested at pilot level.
The Flood Hazard Connector, one of the project’s main committed technical results, translates available flood-hazard information for a user-selected area into structured summaries that JackDaw can explain. It addresses the need to move from a general question about flooding towards spatially grounded information, while remaining dependent on the coverage and quality of external hazard sources.
The Flood Exposure Connector is an additional value-added extension. Where data are available, it can screen components such as population, buildings, roads, land use, agriculture and critical infrastructure against the flood-hazard extent. It can also provide an indicative relative damage component. This is not a calculation of real monetary losses. If an external source is slow or unavailable, the connector can return a controlled partial result and identify what could not be retrieved instead of blocking the complete interaction.
The Multilingual Flood Glossary was implemented after Workshop 2. A participant asked during the session whether the system could understand Portuguese, while Mentimeter recorded ‘Idioma’ and a request to ‘Enable several languages’. The glossary now explains flood-risk terms in English, Spanish, Portuguese and German, with profiles for citizens, farmers and planners or emergency managers. It was technically tested in all four languages after the workshop; its multilingual usefulness was not rated by Workshop 2 participants and still requires stakeholder validation (Figure 5).
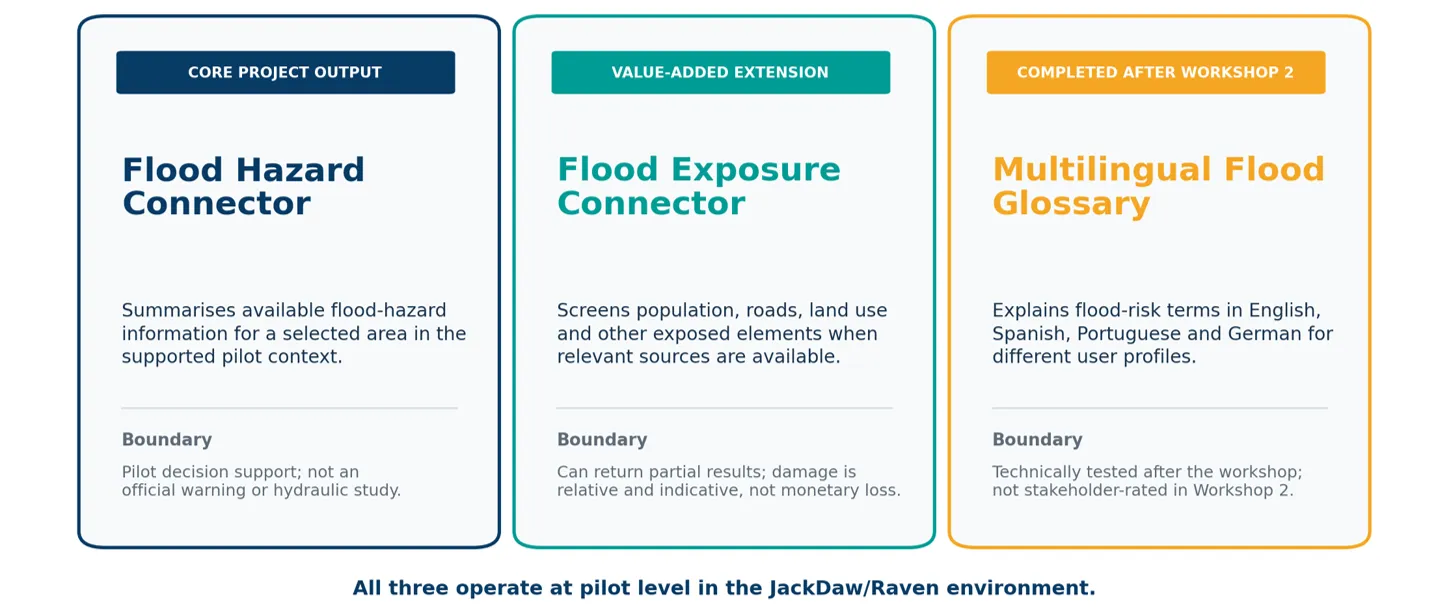
Figure 5 – The three complementary FloodAI+ MCP tools and their public-use boundaries.
Source: FloodAI+ final MCP tools package, commit 7bd0182, generated 17 July 2026.
What worked and what must improve next
Workshop 2 confirmed that JackDaw’s main advantage is not the replacement of a flood map, GIS dashboard or specialist assessment. Its value lies in making a first interaction with spatial flood-risk information faster and more approachable. The strongest next step is therefore to connect that conversational speed to stronger visual evidence: map overlays, clearly located assets, visible sources, more explicit data-coverage messages and role-based guidance on what to ask.
Future validation also needs a broader user mix. More direct participation from farmers and rural organisations, emergency managers, infrastructure operators and municipal planners would test whether the same explanations work outside a technical-leaning sample. Further sessions should distinguish clearly between an implemented tool, a technically verified capability and a benefit demonstrated by stakeholders.
“The workshop did not validate a finished product; it identified the conditions for a more useful and trustworthy pilot.”
Next steps
FloodAI+ will use this evidence to inform the final validation and replication guidance for JackDaw. The immediate priorities are clearer map-based outputs, better localisation of exposure information, visible provenance and uncertainty cues, multilingual and stakeholder-specific explanations, and more representative user testing across the pilot contexts.
The second workshop moved the project from expectations to hands-on evidence. It showed that fast, plain-language access can help people engage with complex spatial information. It also showed that credibility comes from more than a fluent answer: users need to see the place, understand the source, recognise the limits and know how the information can and cannot support a decision.
Funding note: FloodAI+ has received funding from the European Union's Horizon Europe research and innovation programme PoliRuralPlus.
PoliRuralPlus has received funding from the European Union’s Horizon Europe research and innovation programme under Grant Agreement No. 101136910. Views and opinions expressed are however those of the author(s) only and do not necessarily reflect those of the European Union or the European Research Executive Agency. Neither the European Union nor the granting authority can be held responsible for them.

Existing Comments