Earlier this year, the AURA project set out to answer a deceptively simple question: can an AI chatbot built on geospatial, climatic and demographic data actually help people in Central Macedonia make better rural–urban decisions?
To find out, we put JackDaw, the GeoAI chatbot at the heart of this evaluation, in front of real users — municipal planners, tourism stakeholders, and local business advisors — across three pilot use cases: residential planning around Thessaloniki, sustainable tourism for Veria’s “Pink Blossom Valley,” and business intelligence for the Kilkis region.
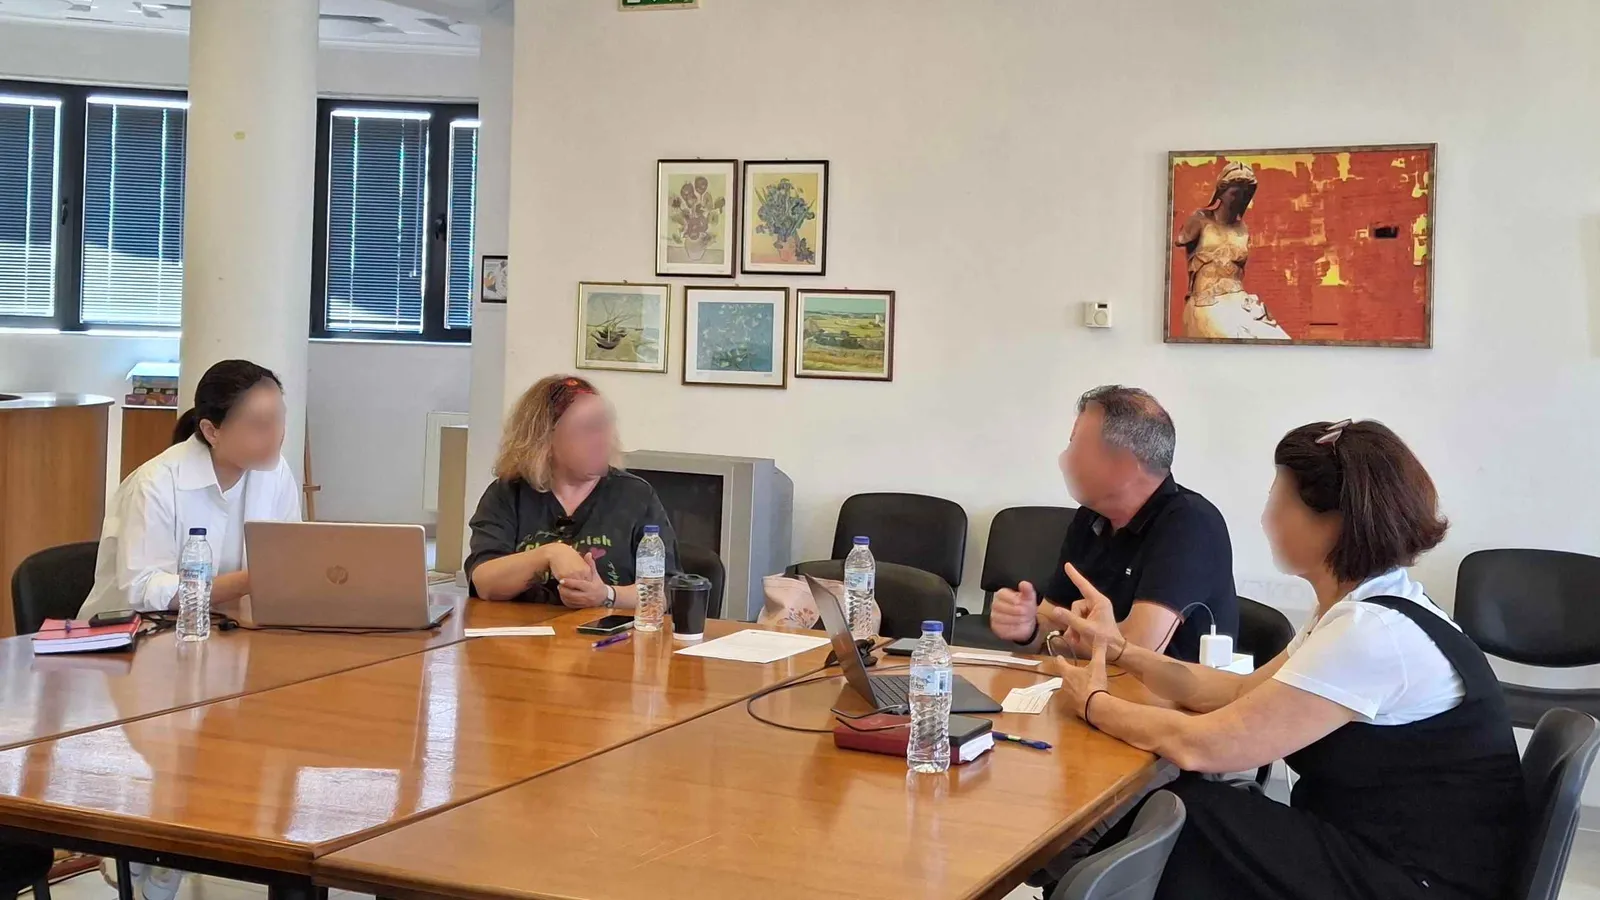
This post shares what we learned from Phase 1: Usability User Testing, the first of three validation phases in our methodology. Nine participants worked through realistic scenarios while we observed, recorded, and asked them to complete standardised questionnaires afterwards.
What We Found: Six Recurring Problem Areas
Across nine sessions, a small number of issues showed up again and again — frequently enough that we’re confident they’re systemic rather than one-off glitches. We grouped them into six thematic clusters and rated each by how often it appeared.
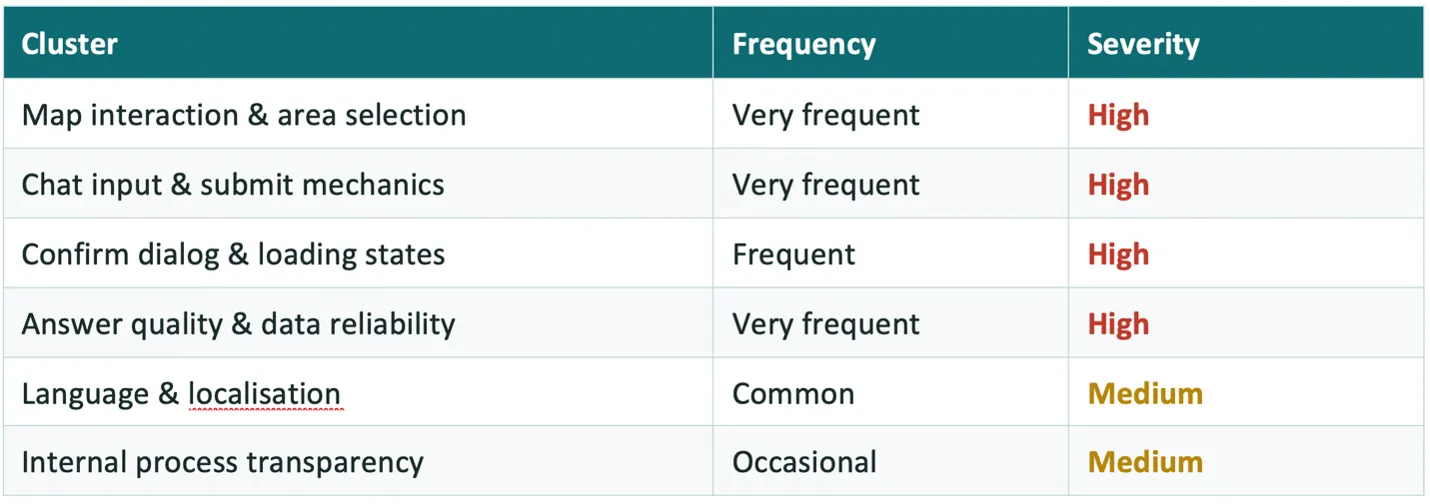
A few patterns stood out as the most disruptive:
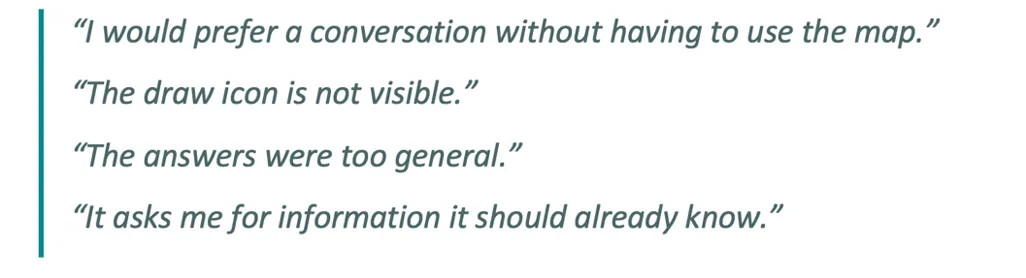
Selecting an area on the map was the single biggest barrier. Almost everyone instinctively tried to zoom into a region rather than draw a selection — the actual draw tool was easy to miss, and once found, freehand drawing was fiddly. Several participants couldn’t tell afterwards whether their selection had “stuck,” leading to repeated, frustrated re-draws.
Basic conversational mechanics didn’t behave as expected. Pressing Enter didn’t submit a message — something nearly every participant tried at least once. The input field also changed position as the conversation grew, so people lost track of where to type.
Confirmation prompts were easy to miss entirely. When JackDaw needed a user to confirm a data query, the confirm button often appeared below the visible screen area while a loading spinner kept running above it — so people waited, assuming the system was still “thinking,” when it was actually waiting on them.
Trust in the answers was fragile. Several users received responses that felt generic, occasionally factually wrong (incorrect temperatures, wrong weekdays, a mix-up between Veria and a similarly-named town), or contradicted what they could see on the map themselves. A recurring theme: when JackDaw didn’t have an answer, it tended to hedge or offer a vague alternative rather than clearly saying so — and that uncertainty was more damaging to trust than a direct “I don’t have that information” would have been.
What the Questionnaires Told Us
Beyond observation, all nine participants completed the System Usability Scale (SUS) — a standard 10-item questionnaire — and rated each scenario individually on ease of use, data adequacy, and decision-support value.
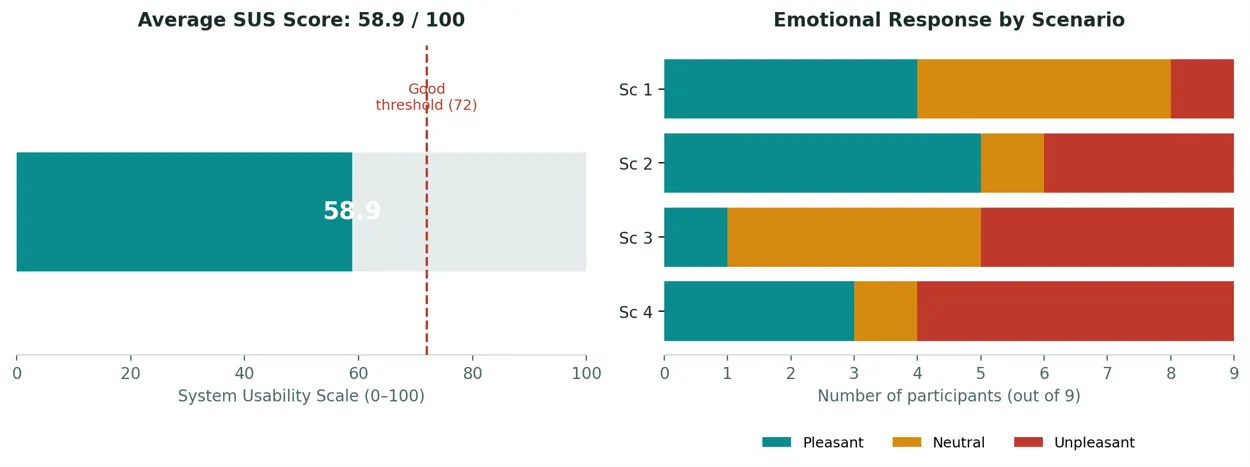
The average SUS score came out to 58.9 out of 100, which falls below the conventional “Good usability” threshold of 72. Just as notable as the average was the spread: individual scores ranged from 25 to 80, meaning some participants had a genuinely workable experience while others struggled throughout.
The scenario-by-scenario emotional ratings (left to right above, Scenario 1 through 4) tell a clear story: participants started out cautiously positive, but sentiment deteriorated as scenarios became more demanding. By Scenario 4, unpleasant reactions outnumbered pleasant ones more than three to one.
A few patterns emerged consistently across the open-ended scenario evaluations:
- Users could generally learn the workflow once someone explained the underlying interaction model — this isn’t a hopeless interface, it’s an under-explained one.
- Information was repeatedly rated as insufficient or overly generic, especially in scenarios requiring more specific local knowledge.
- Tellingly, participants often felt that spending more time on a query would not have produced a better answer — suggesting the issue isn’t patience, but a perceived ceiling on what the tool can actually do.
What People Liked
It wasn’t all friction. Participants specifically valued:
- Being able to work with a defined geographic area rather than generic web results
- Moments where the system seemed to anticipate a natural follow-up question
- The interface itself, once understood, felt relatively simple
- The geospatial focus — something they didn’t feel they could get from a generic AI chatbot or search engine
Representative Quotes
Where We Go From Here
These findings are already shaping two parallel tracks of work. First, a set of priority recommendations — covering area-selection redesign, basic input fixes, confirm-dialog visibility, and answer specificity — has been compiled and will be shared with the JackDaw development team through the consortium’s structured feedback process.
Second, and just as important: these results have directly informed Phase 2, our collaborative stakeholder workshops, where we dug into why certain answers felt inadequate and what “good enough” actually looks like for planners, tourism operators, and business advisors in Central Macedonia.
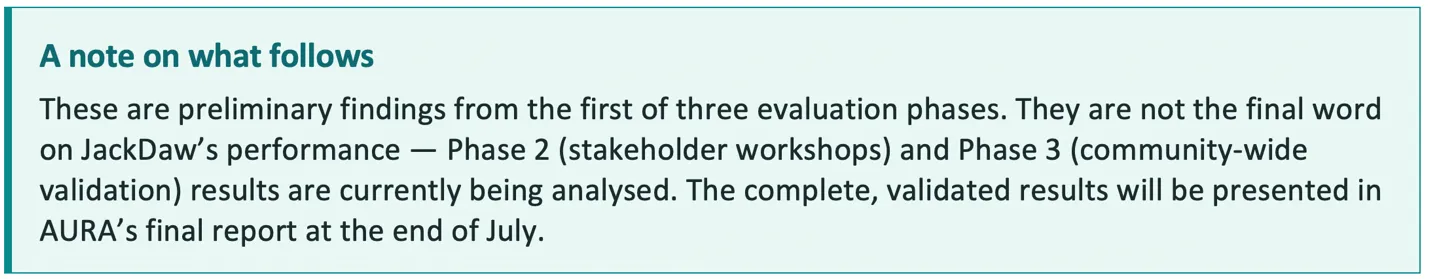
We want to be clear about the status of this work. What you’ve read here is a snapshot from nine usability sessions out of roughly eighty participants that will ultimately take part in AURA’s full validation process. Phase 2 workshops and Phase 3’s community-wide survey are still being analysed, and they may well shift the picture — for better or worse — in ways this early data can’t yet predict.
AURA is part of PoliRuralPlus, funded by the European Union’s Horizon Europe research and innovation programme under grant agreement No. 101136910. Views expressed are those of the authors only.


Existující komentáře